If you’re preparing for the IELTS Academic exam, pie charts in Writing Task 1 can feel intimidating. You may have wondered, “Where do I even start?”
That’s exactly what this guide is here for! Think of this as a live lesson: we’ll walk through each part of tackling a pie chart, explain the tricky concepts, and give you tips, examples, and exercises along the way. By the end, you’ll know how to confidently write about any single pie chart question and aim for Band 7+.
In this article, you will learn:
- IELTS Writing Task 1 Pie Chart – Quick Summary
- Understanding Pie Charts in IELTS Writing Task 1 (Big Picture First)
- How to Write the Introduction for an IELTS Task 1 Pie Chart (Paraphrasing Guide)
- How to Identify Key Features in IELTS Writing Task 1 Pie Charts
- How to Write a Strong Overview for a Pie Chart (Band 7 Requirement)
- How to Write Body Paragraphs for IELTS Writing Task 1 Pie Charts
- IELTS Writing Task 1 Pie Chart Sample Answer (Band 7+ Model Explained)
- Pie Chart Vocabulary & Sentence Starters for IELTS Writing Task 1
- Common Grammar Mistakes in IELTS Writing Task 1 Pie Charts
- IELTS Writing Task 1 Pie Chart FAQ
- Final Thoughts
Let’s get started!
🥧IELTS Writing Task 1 Pie Chart – Quick Summary
A fast snapshot of everything readers need to know:
-
Time recommended: 20 minutes
-
Minimum words: 150
-
Task type: Academic report (objective description)
-
Score weight: 33% of Writing score
-
Skills tested: Data analysis, trend identification, comparison, clarity
-
Focus areas:
-
Identify largest/smallest slices
-
Compare proportions logically
-
Paraphrase the question in the introduction
-
Write clear overview and grouped body paragraphs
-
-
Goal: Score Band 7+ by following structure, vocabulary, and grammar guidance
Understanding Pie Charts in IELTS Writing Task 1 (Big Picture First)
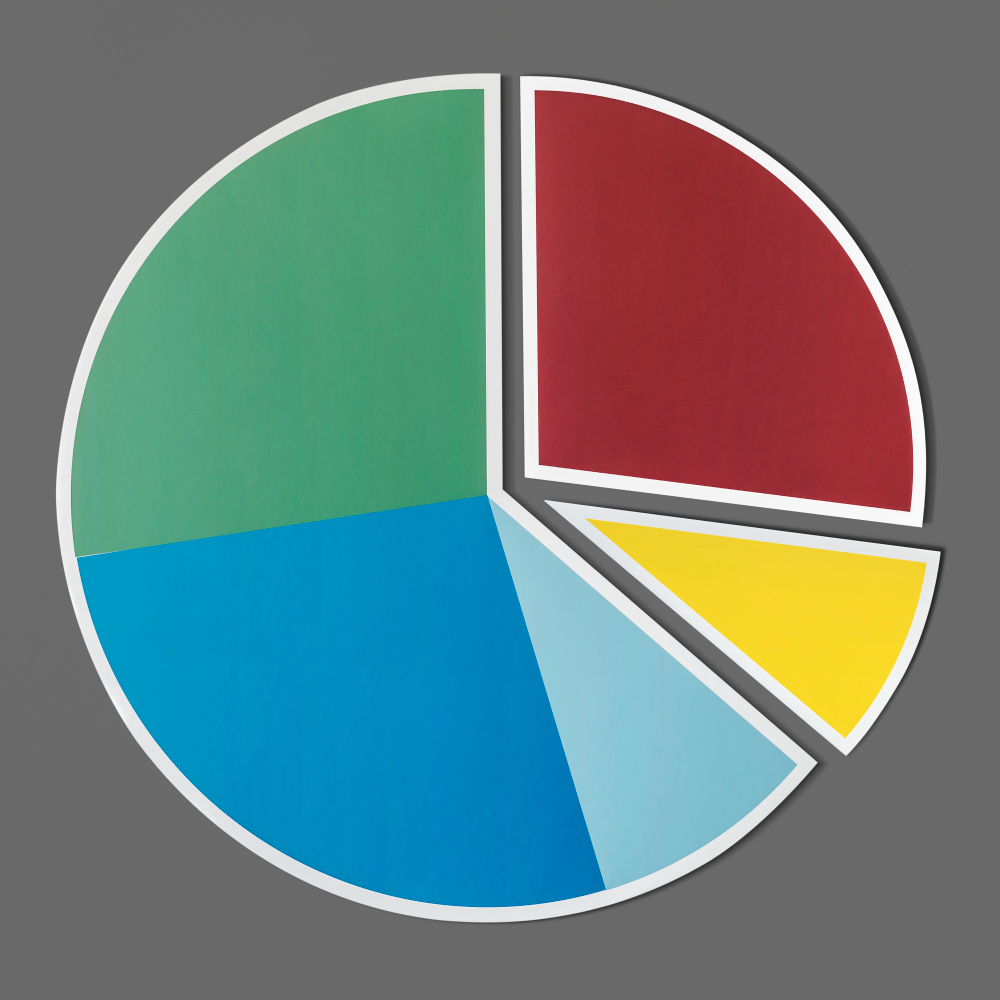
Before you even think about writing, it’s important to step back and look at the chart as a whole. A pie chart represents data as a circle divided into slices, where each slice shows a portion of the total. Larger slices represent bigger percentages, and smaller slices represent smaller percentages. Understanding this basic concept is the foundation for writing a strong answer.
For example, imagine a chart showing how students spend their free time. Watching TV might account for 50%, social media for 30%, and reading for 20%. As a student answering IELTS Task 1, your goal isn’t to explain why these numbers are what they are. Think of yourself as a reporter: your job is to describe the data accurately and clearly, highlighting the important trends that an examiner will notice. Usually, these are the largest and smallest slices, which stand out the most.
👉Practice a real pie chart question from our website Now
How to Write the Introduction for an IELTS Task 1 Pie Chart (Paraphrasing Guide)
The introduction is your first chance to show the examiner your English skills. Instead of copying the question word-for-word, paraphrasing demonstrates that you can express the same idea in different words and use a wider range of vocabulary.
Paraphrasing is more than just swapping a few words; it’s about writing the same meaning in a natural and academic way. For instance, if the question says, “The pie chart shows the sources of energy used in the UK in 2020,” you could write, “The chart illustrates the different sources of energy consumption in the United Kingdom in 2020,” or “This chart presents the proportions of various energy sources used in the UK in 2020.” Each version conveys the same meaning, but it shows variety in word choice and sentence structure.
Using synonyms is key here. Words like “shows” can become “illustrates” or “presents,” and “types” can become “categories” or “sources.” By doing this, your introduction immediately looks more academic and polished, setting the tone for a high-scoring answer.
How to Identify Key Features in IELTS Writing Task 1 Pie Charts
Before writing your overview, take a moment to observe the chart as a whole. Look at what stands out, what is unusual, and what trends are obvious. The goal here is to pick out the most important features that an examiner will expect to see in your answer.These key features directly relate to the IELTS Task 1 band descriptors, which reward candidates who can clearly identify main trends, make relevant comparisons, and avoid unnecessary detail.
Focus first on the largest slice, which represents the category with the highest percentage, and then notice the smallest slice, the one with the lowest percentage. Also, look for notable differences between categories – for example, one slice might be twice as large as another, which is something worth highlighting in your description.
For instance, if a chart shows that students spend 50% of their time watching TV, 30% on social media, and 20% reading, the largest slice is clearly TV, the smallest is reading, and the difference between them is significant. These are the points you would focus on when writing your overview and details. To make your writing flow naturally, you can begin sentences with phrases like, “It is noticeable that…” or “One of the main features is…”
👉 Identify key features in a real pie chart Here
How to Write a Strong Overview for a Pie Chart (Band 7 Requirement)
Now that you’ve identified the key features, it’s time to summarize the big picture. The overview is a short paragraph that tells the examiner the most important trends without going into too much detail. Think of it as giving a general impression before explaining specifics.
| A good overview focuses on the largest and smallest slices and highlights overall patterns. For example: |
Writing the overview first helps structure your answer logically and gives the examiner a clear idea of what to expect in the detailed paragraphs.
How to Write Body Paragraphs for IELTS Writing Task 1 Pie Charts
With the overview in place, it’s time to bring the chart to life in your details section. Here you explain percentages, make comparisons, and highlight patterns. Think of it as telling a story about the data.
Begin by grouping similar categories together. For example, if students spend 50% of their time watching TV, 30% on social media, and 20% reading, instead of listing the numbers, you could say, “Watching TV and social media together account for 80% of students’ free time, whereas reading makes up only 20%.” This way, you show relationships between the slices and make your paragraph flow naturally.Many IELTS Task 1 common mistakes happen at this stage, such as listing numbers without comparison, using vague language, or failing to group similar categories logically.
Always use precise numbers.
Avoid vague words like “most” or “some” because they do not show accuracy.Replace general statements with exact percentages.
Instead of writing “Most energy comes from fossil fuels,” write:
“Fossil fuels account for 60% of total energy, nuclear energy represents 25%, and renewable energy makes up 15%.”Exact figures make comparisons clearer.
Using numbers allows you to clearly show trends and relationships, such as:
“Fossil fuels account for more than double the proportion of nuclear energy.”Use linking words to connect your ideas smoothly.
Words like whereas, compared to, and in contrast help the reader understand similarities and differences between categories.Combine linking words with academic vocabulary.
Use expressions such as accounts for, represents, and constitutes to make your writing sound more professional and varied.
👉Start Practicing writing body paragraphs for real pie charts
IELTS Writing Task 1 Pie Chart Sample Answer (Band 7+ Model Explained)🏆
Studying IELTS Task 1 sample answers like the one below helps you understand how examiners expect ideas to be organized and compared.
Let’s bring everything together with a complete example. Consider a pie chart illustrating energy consumption by source, where oil accounts for 40%, gas for 25%, coal for 15%, while nuclear and renewable energy each represent 10%.
A strong introduction could be written as:
“The pie chart illustrates the distribution of energy consumption by source.”
For the overview, you might say:
“Overall, oil is the dominant energy source, whereas nuclear and renewable energy contribute the smallest shares.”
In the details section, the relationships between the slices should be explained clearly and logically:
“Oil accounts for 40% of total energy consumption, making it the largest source. Gas follows at 25%, while coal represents a more modest 15%. By contrast, nuclear and renewable energy each make up only 10%, jointly accounting for the smallest proportion of energy use.”
Mini Practice Exercise🎯
Now it’s your turn. Check multiple Practice Exercises with us and Write a full sample answer
Pie Chart Vocabulary & Sentence Starters for IELTS Writing Task 1
Here’s a handy table for linking words, proportion and comparison vocabulary, and sentence starters. Use it to plan your writing, vary your language, and check accuracy.
| Category | Examples | How to Use / Tips |
|---|---|---|
| Linking Words – Compare | compared to, relative to, more than | Show differences. “Fossil fuels account for 60%, more than double nuclear energy at 25%.” |
| Linking Words – Contrast | whereas, while, in contrast | Highlight differences. “Renewable energy makes up 15%, whereas fossil fuels account for 60%.” |
| Proportion Vocabulary | accounts for, makes up, represents | Describe slice size accurately. “Reading makes up 20% of leisure activities.” |
| Comparison Vocabulary | higher than, lower than, double the proportion | Show relationships. “Sports 30%, higher than music 10%.” |
| Sentence Starters – Introduction | The chart illustrates…, shows…, presents… | Paraphrase the question. |
| Sentence Starters – Overview | It is clear that…, Overall… | Summarize trends in 1–2 sentences. |
| Sentence Starters – Details | Fossil fuels account for…, Renewable represents…, Compared to… | Describe numbers, proportions, comparisons. |
Common Grammar Mistakes in IELTS Writing Task 1 Pie Charts
Grammar issues are among the most frequent IELTS Task 1 common mistakes, even when the data description itself is clear.Even the clearest report will fall short if the grammar is off.
Key Rules:
-
Present Simple Tense – describe chart data in the present
✅ “Fossil fuels account for 60%.” -
Subject-Verb Agreement – match singular/plural
✅ “Fossil fuels account,” not “accounts” -
Comparatives – use correct forms
✅ “Fossil fuels are higher than nuclear energy.” -
Active Voice – clear and direct
-
Sentence Structure – focus on one idea per sentence
| Mistake | Correction |
|---|---|
| Fossil fuels accounts for 60% | Fossil fuels account for 60% |
| Nuclear energies represent 25% | Nuclear energy represents 25% |
| Fossil fuels are 60% whereas renewables 15% | Fossil fuels are 60%, whereas renewables are 15% |
IELTS Writing Task 1 Pie Chart FAQ❓
1. How many slices should I describe in a pie chart?
Focus on the largest, smallest, and any slices with notable differences. You don’t need to describe every slice. Key features matter more to the examiner.
2. Should I compare all slices or just key features?
Always compare the most important slices. Highlight contrasts and relationships rather than listing numbers for every slice.
3. Can I include percentages in my writing?
Yes! Exact numbers make your answer precise. Use expressions like “accounts for,” “represents,” or “constitutes” to link percentages naturally.
4. What linking words work best for pie charts?
Use phrases like “compared to,” “in contrast,” “while,” and “whereas” to show differences or similarities between categories.
5. Should I explain why the numbers are what they are?
No. Task 1 is descriptive, not analytical. Focus on trends, proportions, and comparisons without giving opinions or reasons.
Final Thoughts
If you’re aiming to understand how to score Band 7 in Task 1, the key is following a clear structure, using accurate data comparisons, and aligning your writing with IELTS Task 1 band descriptors. Don’t forget to apply grammar rules and academic vocabulary, and keep practicing with real questions from our website to see your Band score improve🎉
Next Step? Take on the spot move and Master Pie Chart questions with instant feedback
Unlock The IELTS
Listening | Reading | Writing | Speaking | Practice Basics | About IELTS
Related Articles
“IELTS Writing Test – Complete Guide to Task 1 and Task 2 | Test & Score”
“IELTS Writing Task 1 Bar Chart – Band 7 Tips and Sample Answers | Test & Score”
“IELTS Writing Task 1 Line Graph – Vocabulary, Trends and Band 7 Sample | Test & Score”
“IELTS Writing Task 1 Map Questions – Complete Academic Guide | Test & Score”
“IELTS Writing Task 1 Diagram Questions – Language, Structure and Scoring | Test & Score”
“IELTS Writing Task 1 Table Questions – Structure and Band 7 Strategy | Test & Score”
“IELTS Writing Task 1 Mixed Charts – How to Tackle Combined Data | Test & Score”